
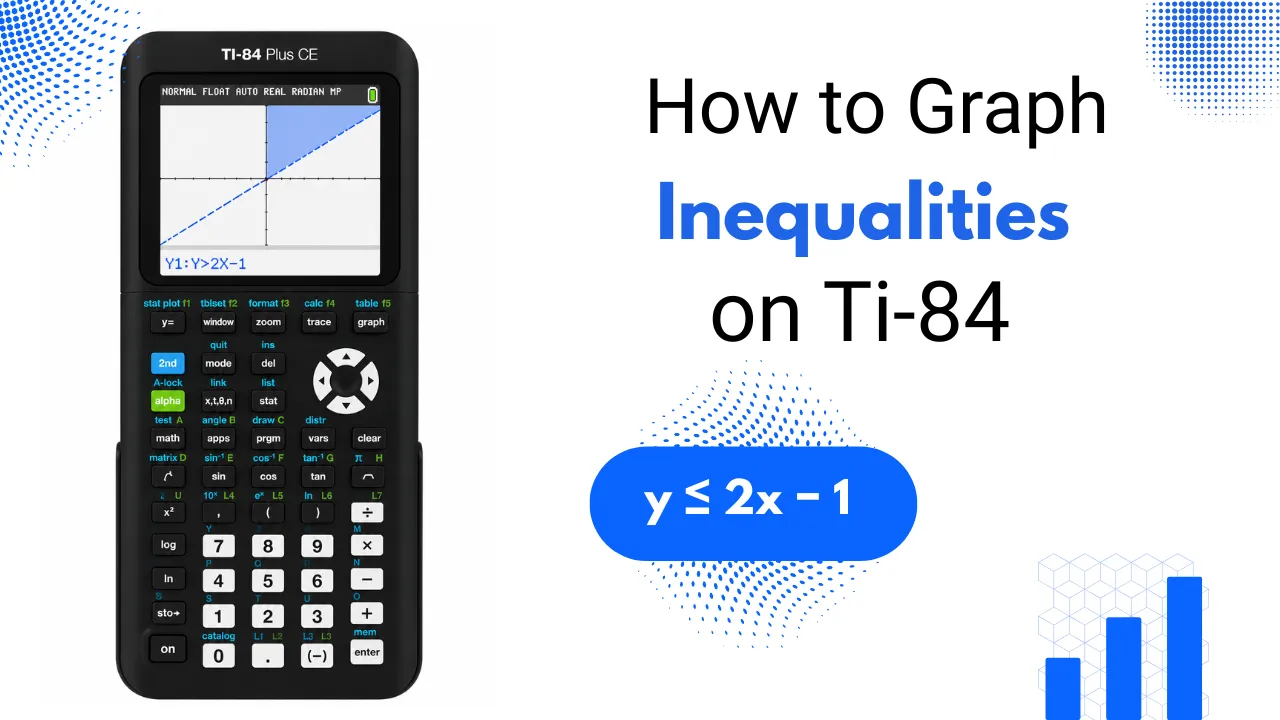
How to Graph Inequalities on TI-84
A regular equation usually creates a single line on a graph, while an inequality represents a whole area of possible solutions. On the TI-84, you can graph inequalities by using different settings depending on the type of inequality. One method works for inequalities with two variables, while another can be used to show solutions on a number line. Both methods are simple once you know which settings to use.
What Is Graphing an Inequality on the TI-84?
Graphing an inequality on the TI-84 means using the calculator to show the solutions of an inequality on a coordinate graph. The TI-84 can display a boundary line and shade the area where the inequality is true. For example, inequalities such as y > x + 2 or y ≤ 2x − 1 can be entered and graphed directly. The type of inequality determines whether the boundary appears as a solid or dashed line and which side of the graph is shaded.
For more features of the calculator, check out the how to use TI-84 effectively guide.
Method 1: Using the Inequality Graphing App
This is the easiest way to graph inequalities on TI-84 for two-variable problems like ( y < 2x + 3 ). It works reliably on all app versions.
The app chooses if the boundary line is solid or dashed. It uses solid for ( \leq ) or ( \geq ) and dashed for ( < ) or ( > ). You can enter multiple inequalities, and the overlapping shaded area shows the solution for the whole system.
Worked Example: y < 2x + 3
Walking through one full example makes the steps easier for future problems.
The screen shows a dashed line through the standard slope-intercept points. The region below the line is shaded, representing all coordinate pairs that satisfy the inequality. Pick a point like (0, 0) and check it against the original inequality: 0 < 2(0) + 3. This confirms that 0 is less than 3. So, the origin lies inside the shaded area, matching the graph.
Checking a Solution with Shades and Trace
After shading a graph, the app offers tools to check specific points. This is helpful once you understand how to graph inequalities on the TI-84. You can confirm your answer before writing it down.
Method 2: Graphing a One-Variable Inequality
The TI-84 doesn’t have a specific tool for one-variable inequalities like x > 3 on a number line. However, you can use Boolean logic to graph inequalities effectively. This method remains helpful when the two-variable approach feels routine.
The calculator treats the statement as a Boolean expression, returning 1 for true and 0 for false. The graph appears as a flat line just above the x-axis, showing where the inequality is valid.
Worked Example: 1 − x > 3
By testing a few values along the flat segment, you can find where it starts. This marks the boundary of the solution set on the number line. Fraction-heavy inequality problems often appear too, and the steps for how to do fractions on a TI-84 fit well with these methods.
Common Mistakes to Avoid
Few mistakes cause confusion for students using the TI-84 to graph inequalities.
Skipping the Inequality Symbol Selection
If you type the expression before choosing the symbol with ALPHA, the calculator misses the inequality information. This often leads to no shaded region appearing.
Misreading Solid Versus Dashed Boundaries
A solid line includes boundary points for ≤ or ≥. In contrast, a dashed line excludes them for strict inequalities like < or >.
Using the Wrong Method for One-Variable Problems
The INEQ app is for two-variable problems. For a one-variable inequality like x > 3, use the TEST menu method instead.
Rushing Past the Shaded Overlap in Systems
When multiple inequalities are graphed, only the overlapping shaded region represents the true solution. Single inequality shading does not show the complete answer.
Conclusion
You can graph inequalities on TI-84 easily. Use the Inequality Graphing app for two-variable problems. For one-variable number lines, use the TEST menu trick. Mastering both methods will help with most algebra and precalculus tasks. After practicing a few problems, switching between them will feel natural.